Detection engineering homelab - design and implementation
tl;dr: A homelab for practicing attack and defense, with a focus on detection engineering.
Introduction
This post introduces a lab environment I am building for practicing attack and defense techniques. The goal is to design a modular lab where individual assets can be attacked, monitored, and defended, allowing both offensive and defensive aspects of a scenario to be analyzed side by side.
In future posts, I plan to walk through complete scenarios. From the attacker’s perspective, this will include identifying and exploiting a vulnerability in a target asset. From the defender’s perspective, the focus will be on how the same activity is reflected in collected telemetry and which detections can be implemented.
The lab supports offensive exercises, but its main focus is detection engineering. Attacks serve to generate realistic activity, emphasizing telemetry quality, signal fidelity, and correlation into actionable detections, rather than exploitation itself.
Requirements
Before jumping right into building, I wrote down a clear set of expectations for the lab. Defining these requirements helped me stay focused on the design and implementation. Without them, it would have been easy to spend time on features that are unnecessary for the intended use case or on components that are difficult to maintain.
The lab should meet the following requirements:
- use free and open-source components, without activation, licenses, or time-limited trials
- support fully automated, non-interactive installation and configuration
- rely on components commonly used in real-world environments
- be modular, with independent scenarios that can be added or removed in the future
Design
Design overview
Based on the defined requirements, I prepared a design with three main layers:
- bootstrapping and host configuration - everything necessary to prepare the host to run the lab
- base lab environment - the minimal set of components that the lab consists of
- lab scenarios - additional components deployed for specific attack and defense scenarios
I was not able to fully meet all defined requirements. When selecting or configuring some components, I made trade-offs in favor of simpler implementation or to experiment with specific software.
Platform and automation
The lab is designed to run on a Linux host using KVM. From the host’s perspective, the lab is a set of virtual machines. VM provisioning and post-installation configuration are automated using Ansible.
Base components
To achieve a minimally functional lab, the following components are necessary:
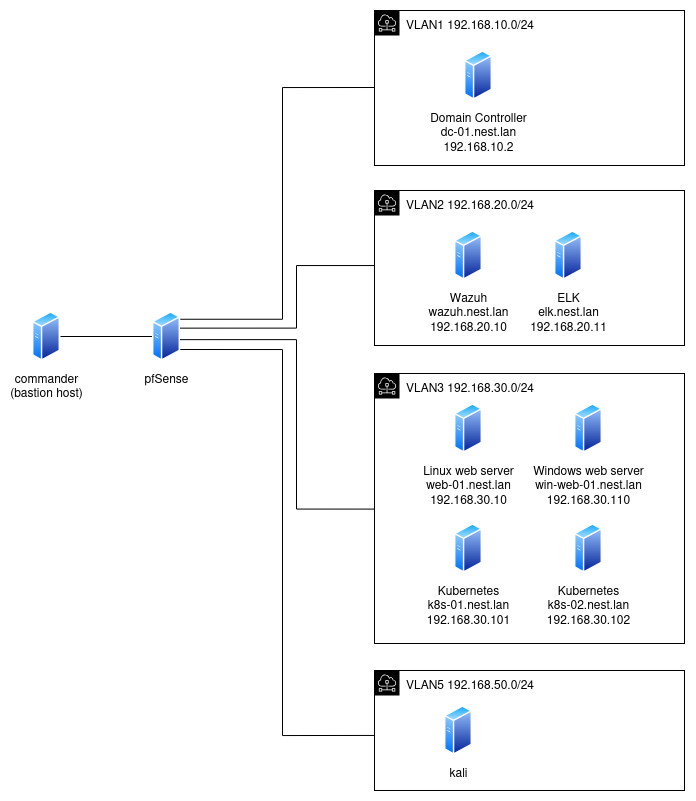
- pfSense - serving as a router, implementing VLANs, monitoring network traffic, and providing DHCP and DNS services with a configured domain (
nest.lan), so VMs can be reached using their fully qualified domain names (FQDNs) - Wazuh - used for telemetry collection from other VMs
- ELK - ingesting logs from Wazuh, used for advanced queries and detection
- Velociraptor - used for collecting custom data when Wazuh telemetry is not sufficient
Scenario assets
For scenarios, I selected a few common types of assets:
- a Linux web server with a web application vulnerable to command injection, with optional WAF protection (
web-01) - a Kubernetes cluster with a web application vulnerable to command injection (
k8s-01,k8s-02) - an Active Directory environment consisting of a domain controller and a web server (
dc-01,win-web-01) - a Kali Linux machine for conducting attacks
Network segmentation
VMs will be placed in VLANs with restricted network reachability:
- VLAN 1 - domain controller
- VLAN 2 - monitoring (Wazuh, ELK, Velociraptor)
- VLAN 3 - servers
- VLAN 4 - unused (reserved for future workstations)
- VLAN 5 - untrusted network, serving as the source of attacks (Kali)
Tradeoffs
As mentioned earlier, I made some tradeoffs that diverge from the defined requirements. Writing them down helped me rationalize my choices but it also serves as a documentation for readers and my future self.
- pfSense automation - pfSense doesn’t support fully automated setup. Installation of the OS and configuration via web interface require interactive steps. However, its features like subnets, firewall, Suricata integration were important for experimentation. Configuration can be exported and imported, so redeployment does not require repeating all steps. I also considered VyOS, which supports automated installation and configuration, but learning VyOS would require more time investment. If automation becomes a bottleneck, the modular lab design allows switching to VyOS later.
- Wazuh vs. ELK - I was initially on the fence which would be the better choice, as both have interesting qualities. Wazuh has file integrity monitoring, vulnerability detection, and predefined alerts out of the box, on the other hand ELK supports more advanced queries and alerts. Although this increases the lab’s complexity, it allows me to get more experience with both and learn more about their differences. I also considered Splunk which offers powerful querying capabilities, but it’s a commercial software. Its trial license is limited in alerting and data ingestion, making it less suitable for my detection practicing goals.
- Active Directory - running Windows Server is not free but there is a trial version available. Setting up a trial Windows machine can be fully automated, so even after the trial ends, this part of the lab can be redeployed without much effort.
Threat Model
The attacker is assumed to have the following capabilities:
- Network access from an untrusted subnet (Kali Linux in VLAN 5)
- No initial credentials
- Ability to perform reconnaissance and exploit exposed services
- Ability to move laterally once initial access is achieved
Implementation
The repository with all the code is available on GitHub. Here I describe the most important parts. Each part is implemented as a separate Ansible playbook.
- Bootstrap playbook - steps performed directly on the host, including:
- configuring networks using
virsh - configuring SSH to simplify connections from the host
- downloading operating system ISO files (Windows Server 2022, Ubuntu Server 24, pfSense, Kali Linux)
- downloading tools (Velociraptor, Sysmon, ELK, Ubuntu Autoinstall Generator)
- configuring networks using
- VM provision playbook - each VM (wazuh, elk, web-01 etc.) has its own playbook that executes the same steps with different parameters (VM name, disk size, memory size, network interface, etc.):
- creating a QEMU disk
- preparing an OS auto-installer ISO (Linux or Windows)
- creating a VM with previously created disk and booting it with the OS auto-installer ISO
- waiting until the OS installation process completes
- Wazuh VM configuration playbook - configures a running Wazuh VM:
- installing Wazuh server
- configuring Wazuh (enabling
logallfeature, enabling Filebeat for ELK integration) - installing Velociraptor server (for simplicity it runs on the same VM)
- ELK VM configuration playbook - configures a running ELK VM:
- installing docker
- copying the ELK installer downloaded by the bootstrap playbook
- preparing ELK configuration files (disabling premium features, connecting to Wazuh using two ingest pipelines: one for archived logs and another for alerts)
- web-01 VM configuration playbook - sets up the Linux web server:
- installing auditd, Wazuh agent, and Velociraptor agent
- installing dependencies for the web application (python3, flask)
- installing nginx and WAF (ModSecurity rules)
- deploying the web application behind the reverse proxy
- k8s-01 VM configuration playbook - sets up the Kubernetes master node:
- installing auditd, Wazuh agent, and Velociraptor agent
- installing and starting MicroK8s
- configuring Fluentbit for log enrichment
- installing Falco
- deploying the web application as a pod
- k8s-02 VM configuration playbook - sets up the Kubernetes worker node:
- installing auditd, Wazuh agent, and Velociraptor agent
- installing MicroK8s and joining the cluster
- dc-01 VM configuration playbook - sets up the domain controller
- installing Sysmon, Wazuh agent, and Velociraptor agent
- configuring Windows Firewall and DNS forwarder
- creating a domain
- win-web-01 VM configuration playbook - sets up the Windows web server:
- installing Sysmon, Wazuh agent, and Velociraptor agent
- installing IIS
- joining the domain
Code reuse
To avoid repeating the same steps across multiple VMs, reusable tasks are implemented as Ansible roles and parameterized. Some examples of roles:
Detection
One of the main aspects of the lab is detection, so choosing appropriate log sources, deploying agents and viewing collected data is worth describing in a separate section.
Linux
Linux machines are running a Wazuh agent. Besides its default configuration, it’s additionally configured to collect logs from:
- auditd (
/var/log/audit/audit.logfile) which is specifically configured to monitor changes in configuration files and program executions - apt history (
/var/log/apt/history.logfile) - nginx (
/var/log/nginx/access.logand/var/log/nginx/error.logfiles) - ModSecurity / WAF (
/var/log/nginx/modsec_audit.logfile)
Ansible task responsible for configuring auditd:
- name: Deploy auditd rules
  copy:
    dest: /etc/audit/rules.d/audit.rules
    content: |
      -D
      -w /etc/ -p wa -k config_changes
      -w /var/lib/systemd/ -p wa -k config_changes
      -w /root/ -p wa -k root_changes
      -a exit,always -F arch=b64 -S execve -k exec_commands
      -a exit,always -F arch=b32 -S execve -k exec_commands
  notify:
    - Restart auditd
    - Reload audit rules
Kubernetes
There are also Kubernetes-related logs that are worth looking at. Wazuh will collect the following logs:
- Kubernetes audit logs generated by Kubernetes API usage
- container logs enriched with relevant metadata using FluentBit
- Falco alerts of suspicious activities within a cluster
If Wazuh was collecting raw container logs, then it would be difficult to correlate them with the pod that emitted it. By using FluentBit, Wazuh will collect logs that include additional metadata like pod name, namespace, container image that in case of an incident, will allow to track down the affected asset.
Raw container log:
2025-12-30T15:54:08.55449382+01:00 stderr F INFO:root:Starting the service
The same log enriched by FluentBit:
{
    "time": "2025-12-30T15:54:08.55449382+01:00",
    "stream": "stderr",
    "flags": "F",
    "log": "INFO:root:Starting the service",
    "kubernetes":
    {
        "pod_name": "ping-api-4bw6l",
        "namespace_name": "default",
        "pod_id": "e9366a07-e0bf-4eab-8ff7-2c20fdd4fea0",
        "labels":
        {
            "app": "ping-api",
            "controller-revision-hash": "6847f66956",
            "pod-template-generation": "4"
        },
        "annotations":
        {
            "cni.projectcalico.org/containerID": "e79ab9b3a0c254a0eaf378f49866b0797228ac7f9783e47c4083b531a7bfdc16",
            "cni.projectcalico.org/podIP": "10.1.61.206/32",
            "cni.projectcalico.org/podIPs": "10.1.61.206/32",
            "kubectl.kubernetes.io/restartedAt": "2025-12-28T21:11:42+02:00"
        },
        "host": "k8s-01",
        "pod_ip": "10.1.61.206",
        "container_name": "ping-api",
        "docker_id": "0eddb95ce4c6df673639571a774643b801e08054d8b3a8dca1998abfc34095e8",
        "container_hash": "k8s-01.nest.lan:32000/ping-api@sha256:43d87a8f2f4367307c894d98032165209204350eca8e444959f6b264b2929bd1",
        "container_image": "k8s-01.nest.lan:32000/ping-api:latest"
    }
}
Windows
Wazuh collects Windows event logs as a core source of telemetry. In the lab this is extended by using:
- custom audit policies enabling additional events (based on Starke427’s Windows Security Policy)
- Sysmon producing additional security-related logs (based on NextronSystems’s sysmon config)
Ansible Task enabling collection of Sysmon produced logs:
- name: Configure sysmon in wazuh
  community.windows.win_lineinfile:
    path: 'C:\Program Files (x86)\ossec-agent\ossec.conf'
    insertafter: '<ossec_config>'
    line: |
      <localfile>
        <log_format>eventchannel</log_format>
        <location>Microsoft-Windows-Sysmon/Operational</location>
      </localfile>
    create: no
  when: sysmon_line_check.stdout == ""
  notify: Restart wazuh
pfSense
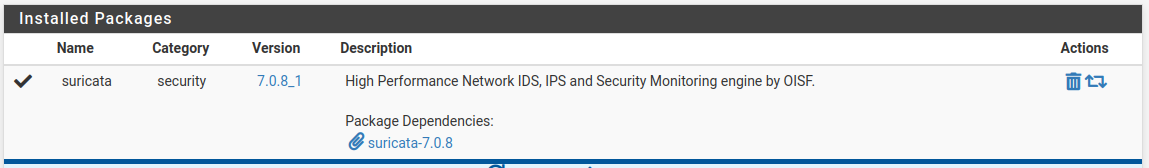
pfSense being a central point of network communication between VMs (or subnets to be more specific) is a great source of network telemetry. pfSense has a firewall that writes packet filtering decisions to /var/log/filter.log. It also supports additional functionalities through a Package system. For the purpose of this lab I added Suricata and configured Wazuh to collect logs from it.
Wazuh configuration to collect logs from firewall and Suricata:
<localfile>
    <log_format>json</log_format>
    <location>/var/log/suricata/*/eve.json</location>
</localfile>
<localfile>
    <log_format>syslog</log_format>
    <location>/var/log/filter.log</location>
</localfile>
Overview
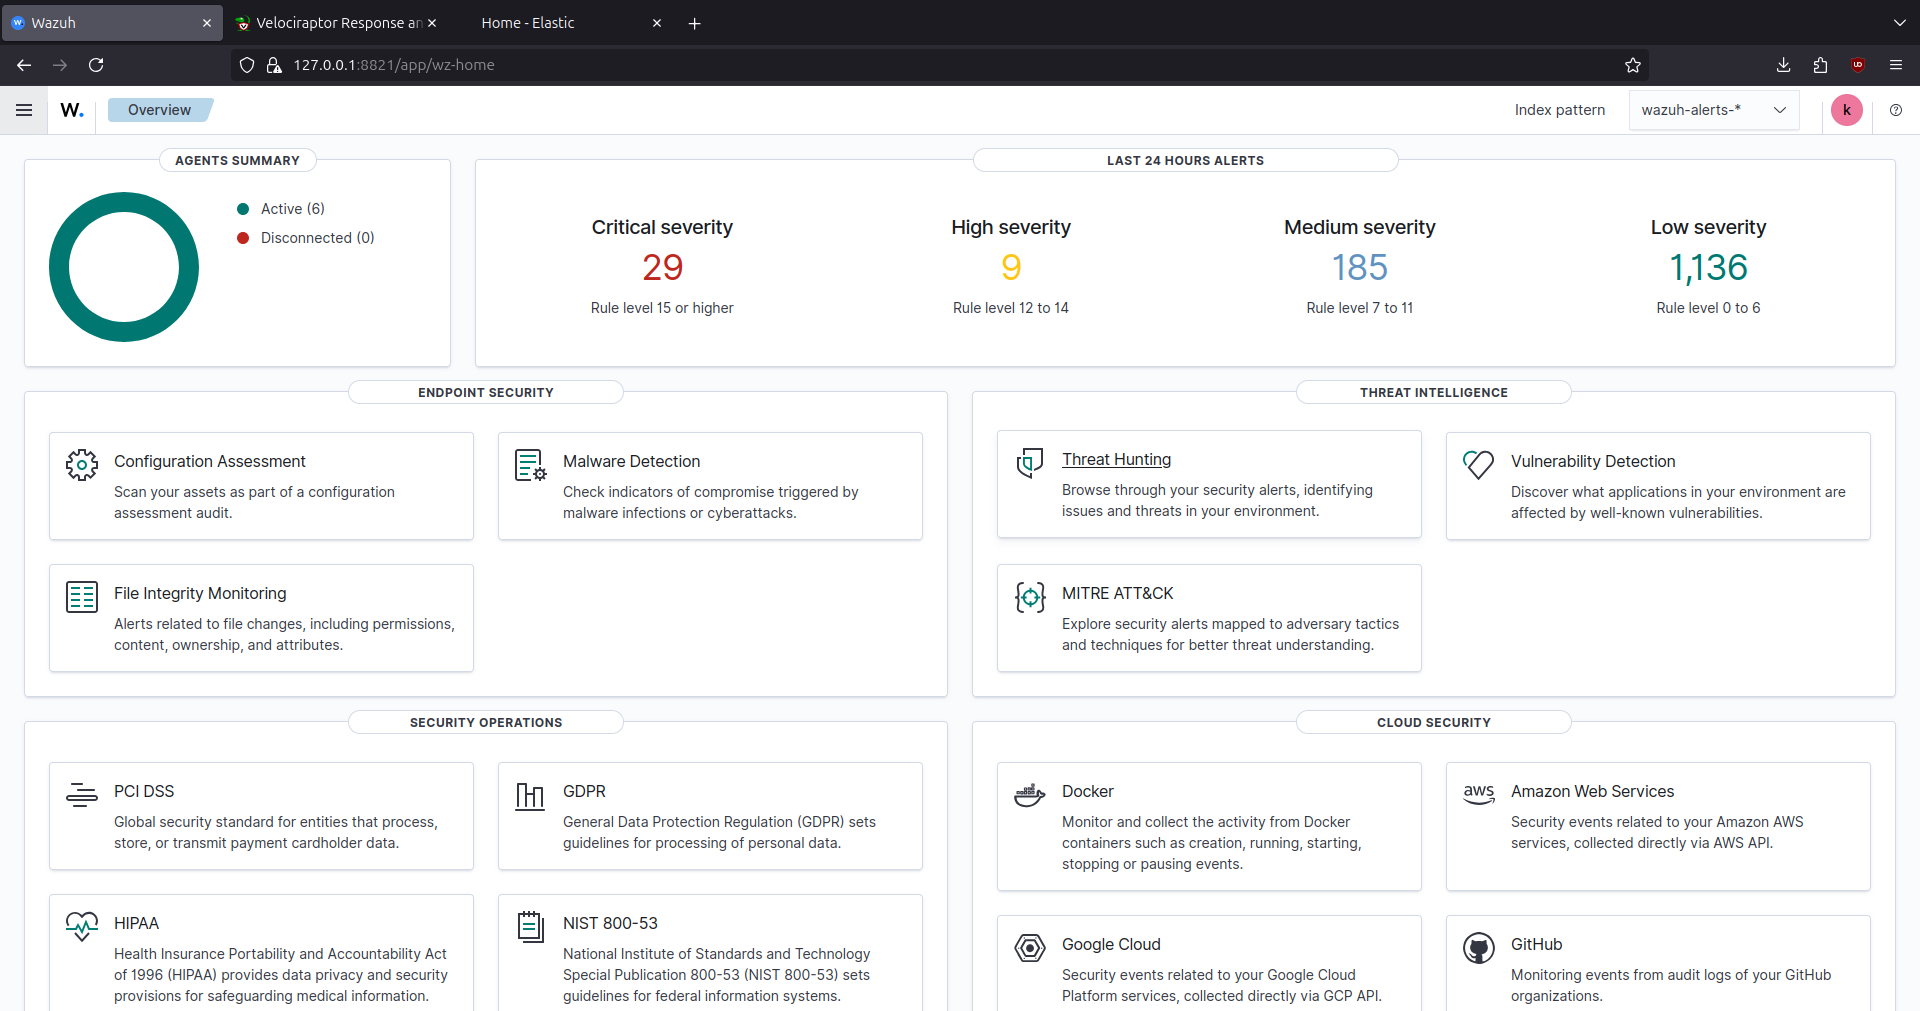
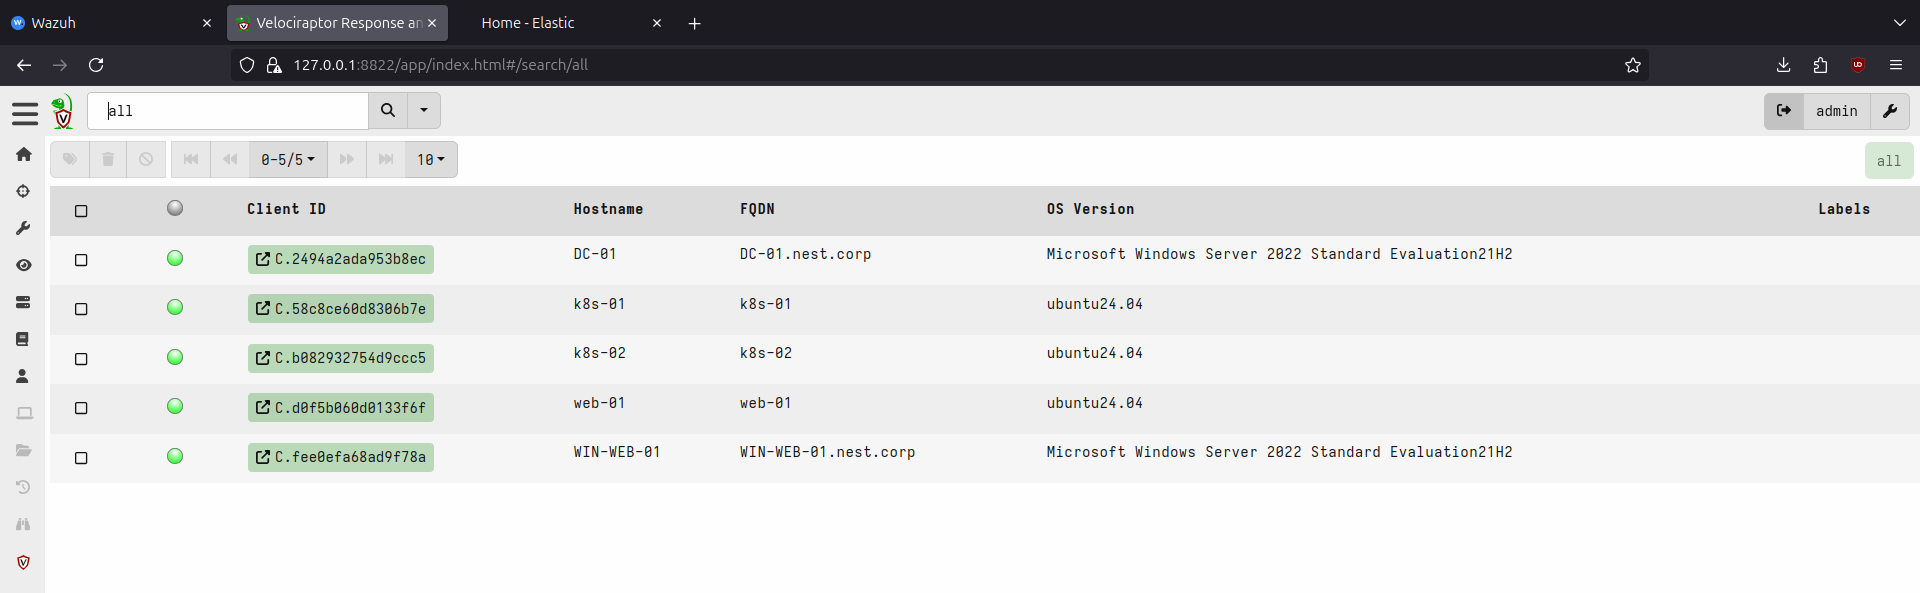
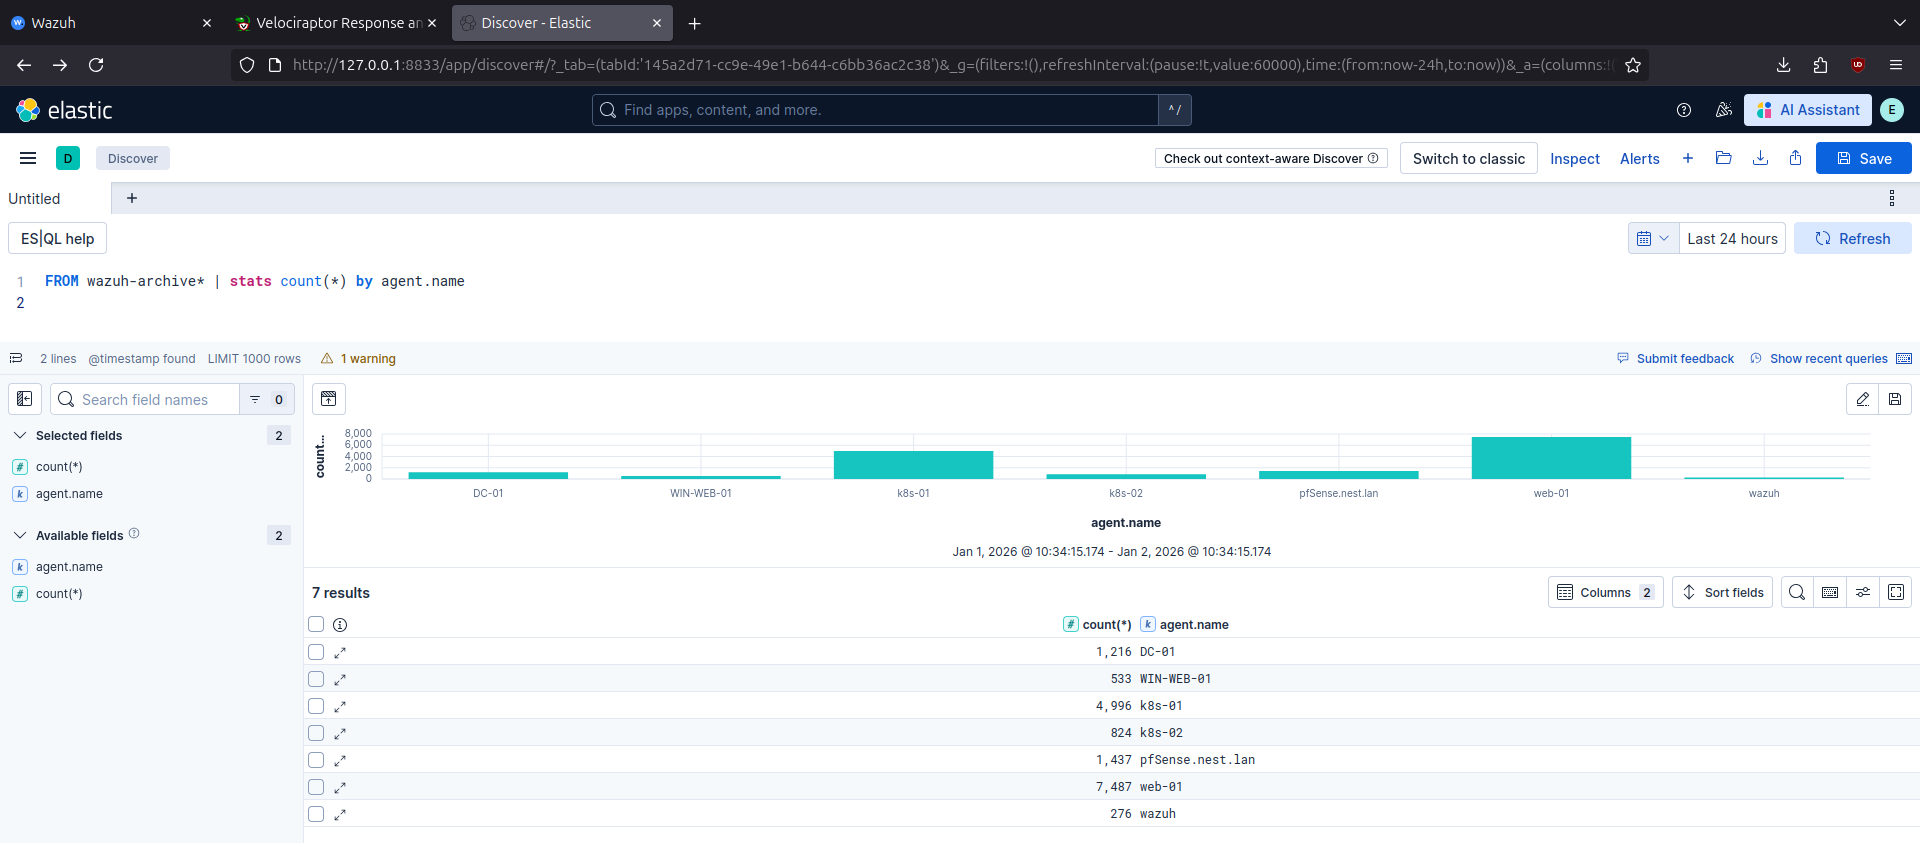
After deploying the lab through Ansible playbooks, we can see in Wazuh and Velociraptor dashboards that agents are connected and in ELK that logs are being collected and can be queried.
Wazuh:
Velociraptor:
ELK:
Summary
This post was an introduction to the lab design, implementation, and deployment. It is ready for conducting attacks and responding to them. Next posts will be focused on specific scenarios from both attacker and defender perspective.